Portfolio optimisation platform for energy companies
Understanding and making decisions on your portfolio of hydrocarbon and CO2 storage assets, requires seamless integration of multiple data and information sources and effective analysis tools.
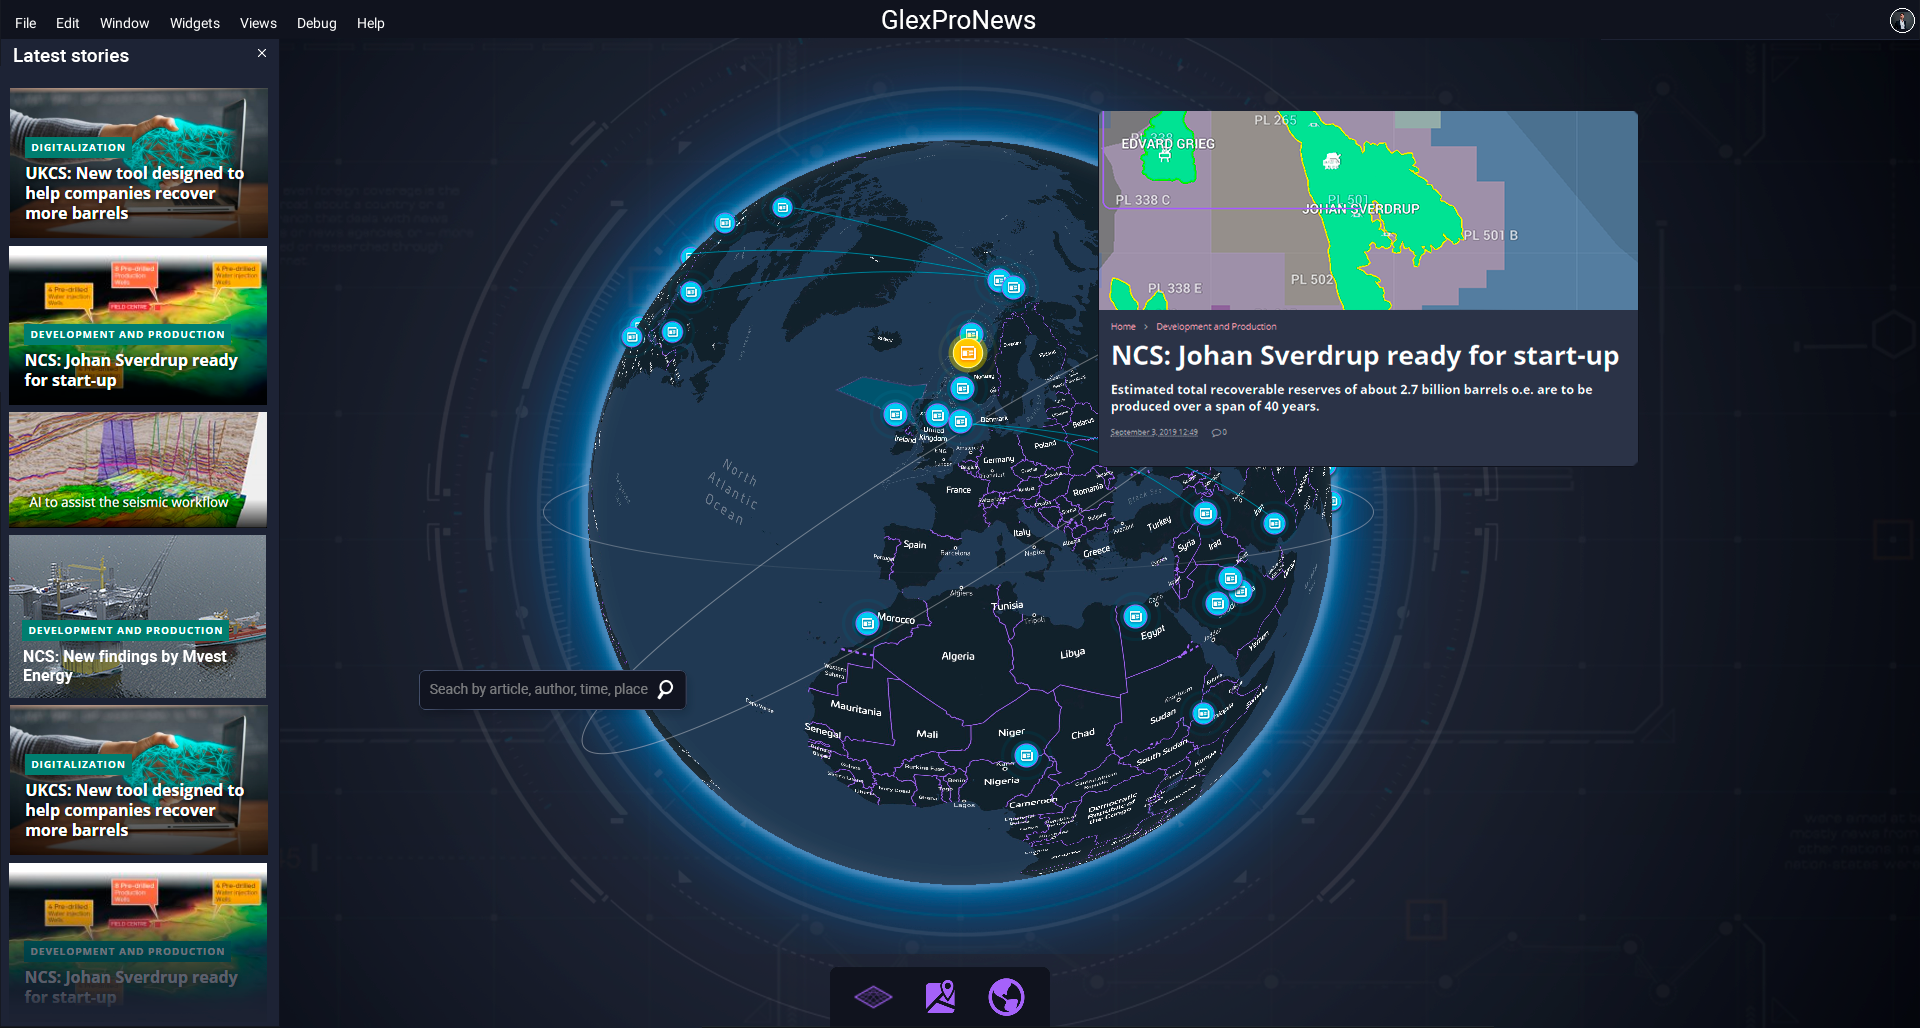
Glex Energy is a map-centred optimisation platform which enables your whole organisation to share, analyse and collaborate on data, information and analysis from external and internal sources to discover and evaluate opportunites within and outside your own portfolio.
Technical and economic screening and ranking tools give you deeper insight into your opportunities and the solid foundation you need for effective decision making.
Whether you are a global E&P organisation or a niche player,
Glex Energy transforms the way you optimise your portfolio.
Whether you are high-grading your own portfolio or evaluating business opportunities in the market, Glex Energy gives you the data and tools you need to assess production and economic impact across the value chain, without resorting to spreadsheets.
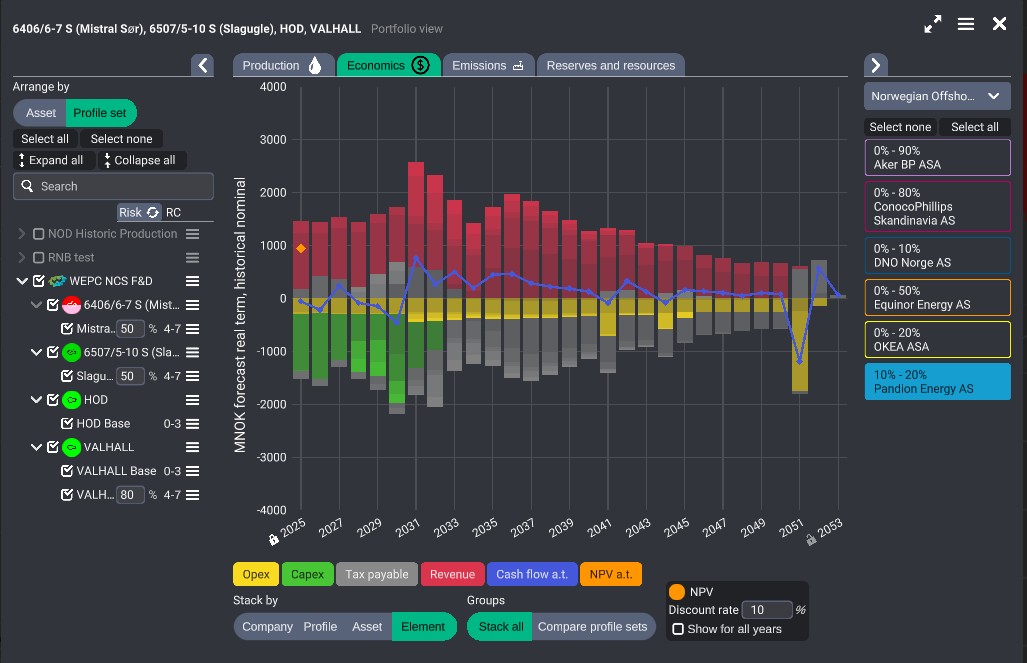
From volume/risk ranking of prospects to NPV evaluation of production and cost profiles, you can easily and securely combine and compare your own evaluations with subscribed third-party analyst assessments.
Flexible filters, smart search and advanced visual tools make data discovery a natural part of the workflow.
Your own data and information is combined seamlessly with automatically updated public and subscribed data. Unstructured data like documents are linked to their assets, making them easy to find, access and utilize.
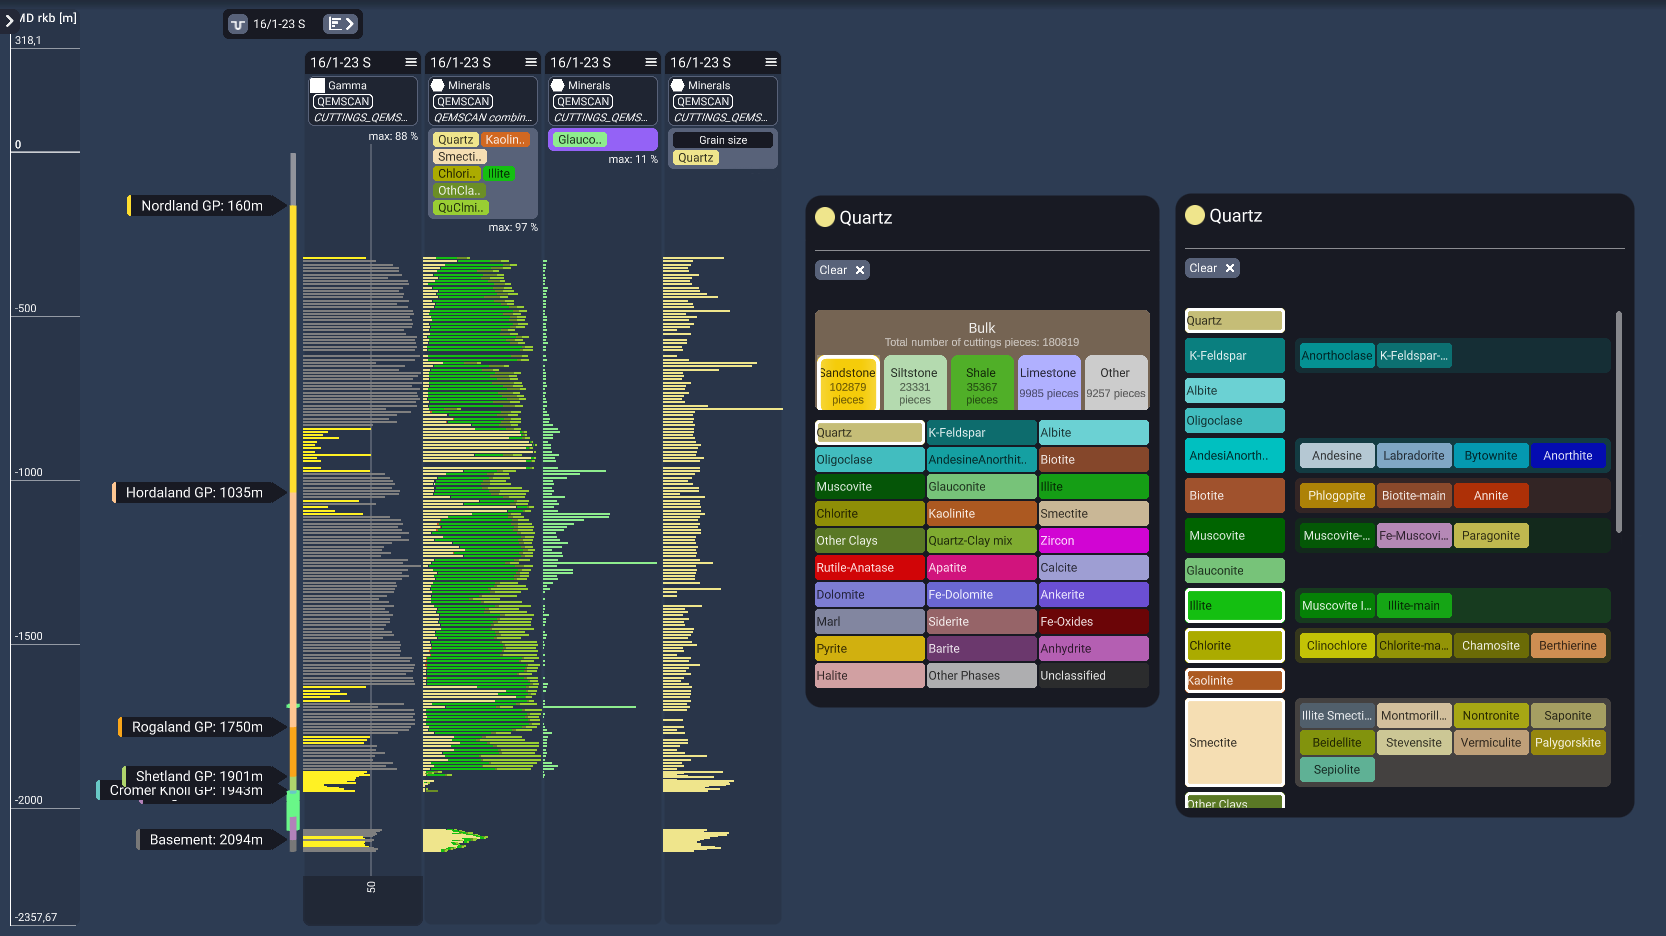
Perform fast and efficient screening of well log and cuttings data by plotting and visualizing data from multiple sources. Screen single or multiple wells and visualize data alongside the well trajectory, in pie charts or in cross plots.
Import your own geological surfaces and combine with GDE, play and structural maps.
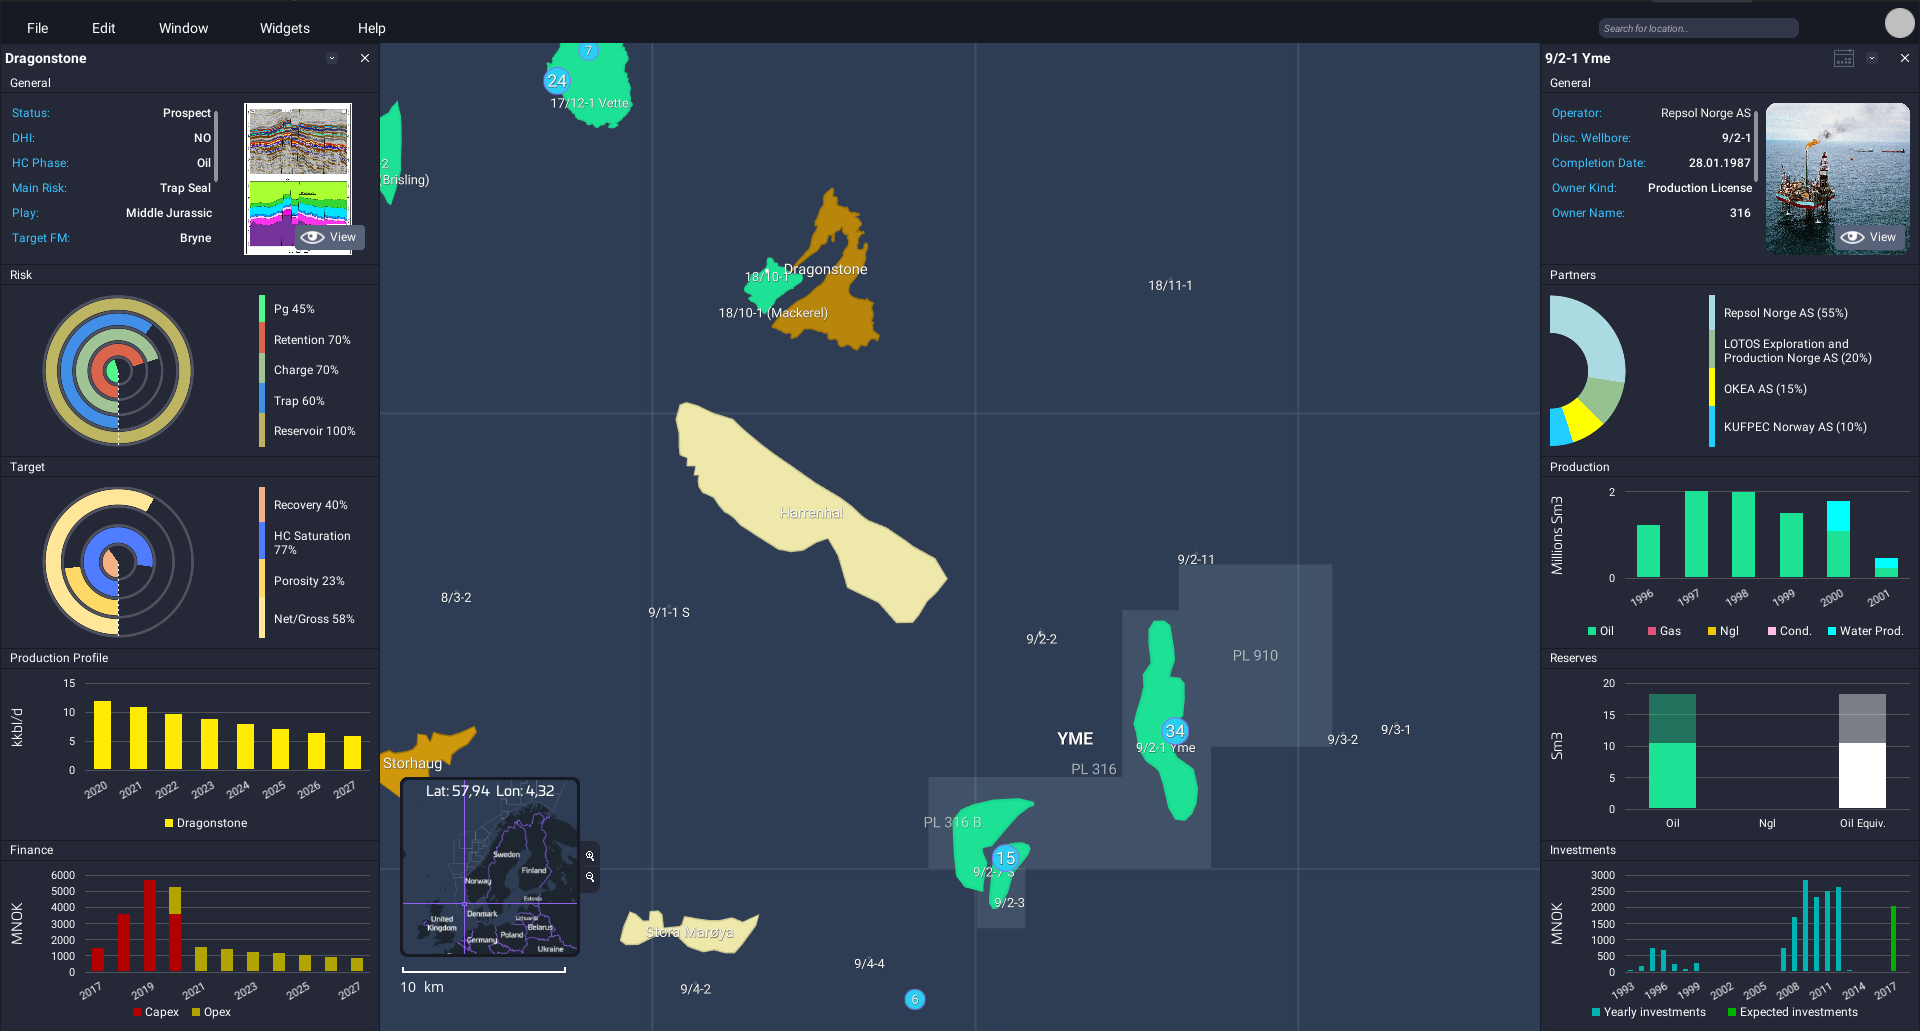
QC exploration prospect input data by comparing with well zone average data and other geological data on the map.
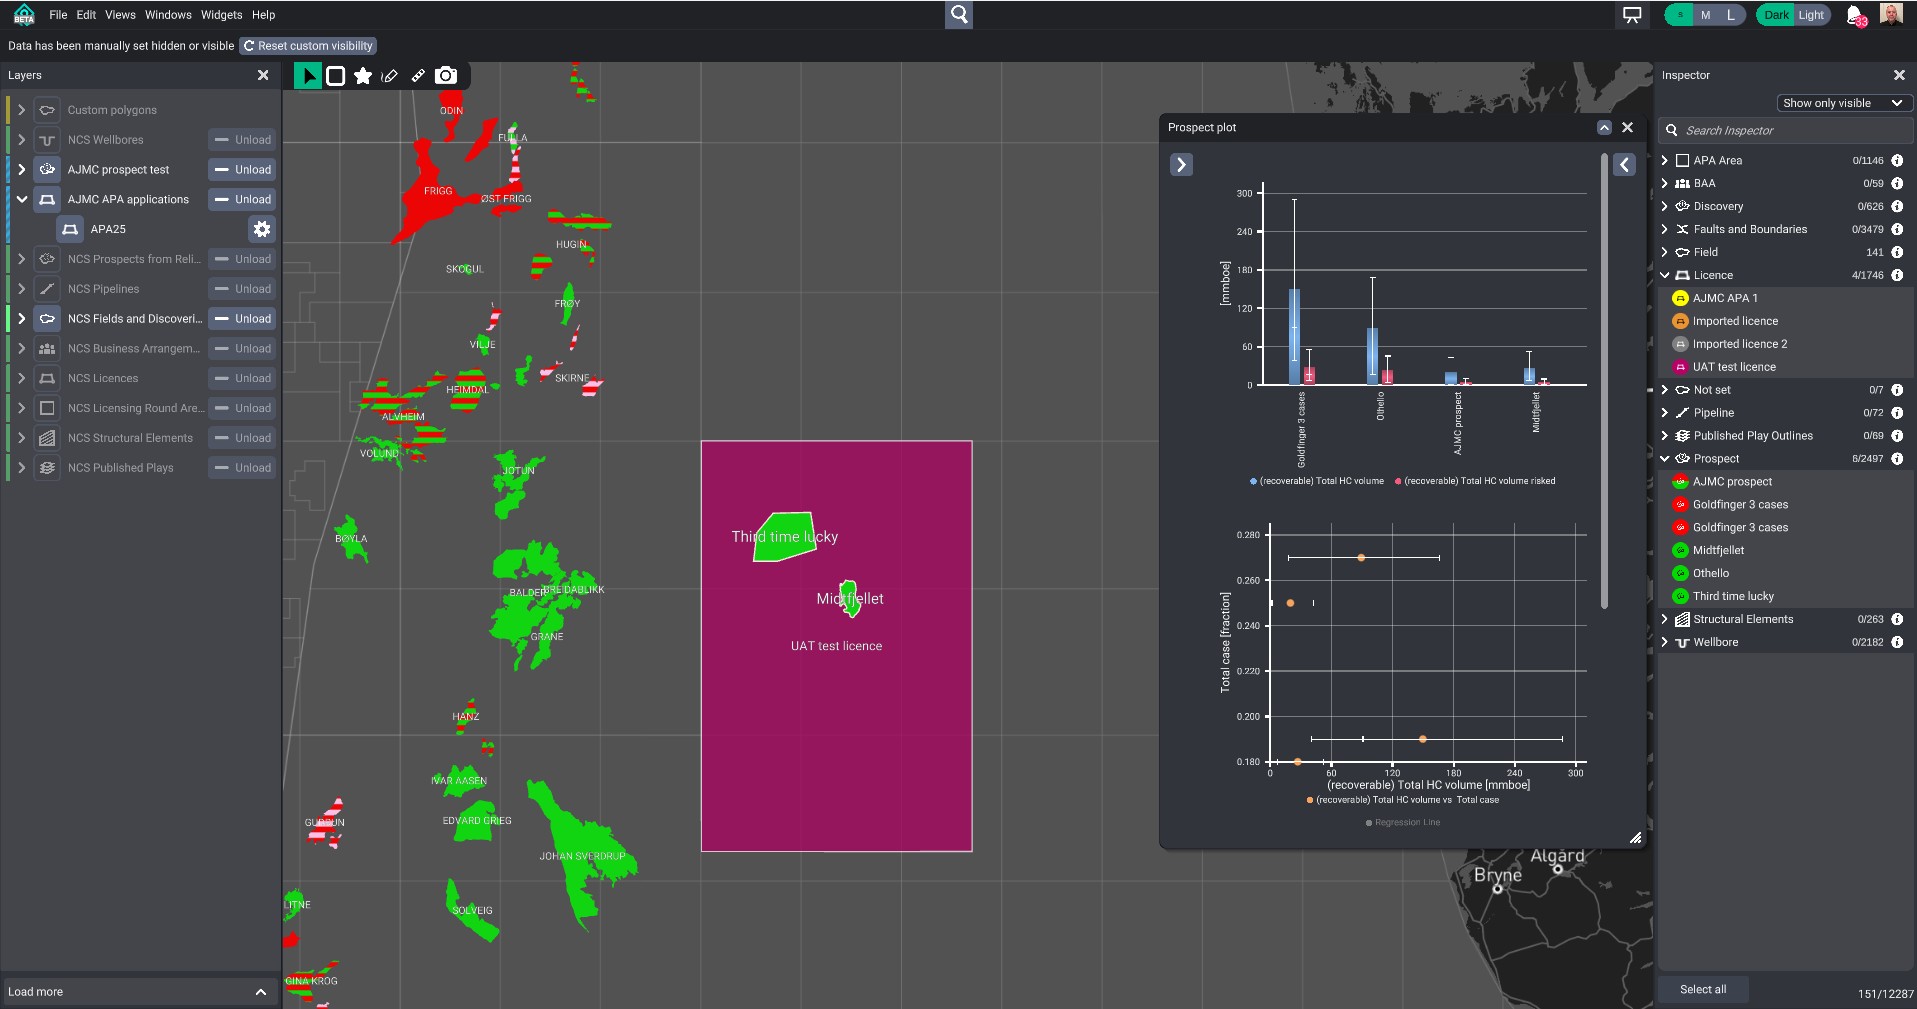
Build your inventory of exploration prospects with direct links to industry standard tools like REP and Geox.
QC input and rank volumes and risk. Add production/cost profiles to integrate with the rest of the value-chain to understand the potential impact of success.
Add production/cost profiles from operators, datarooms or internal sources to any asset and compare portfolio impact together with updated third-party analysis.
Integrated presentation tools provide teams with the means to stay up to speed and leverage the analysis work done. Information is always updated when shared across your organisation.
Prepare documentation for decision processes and licensing rounds with data always coming freshly from your databases.
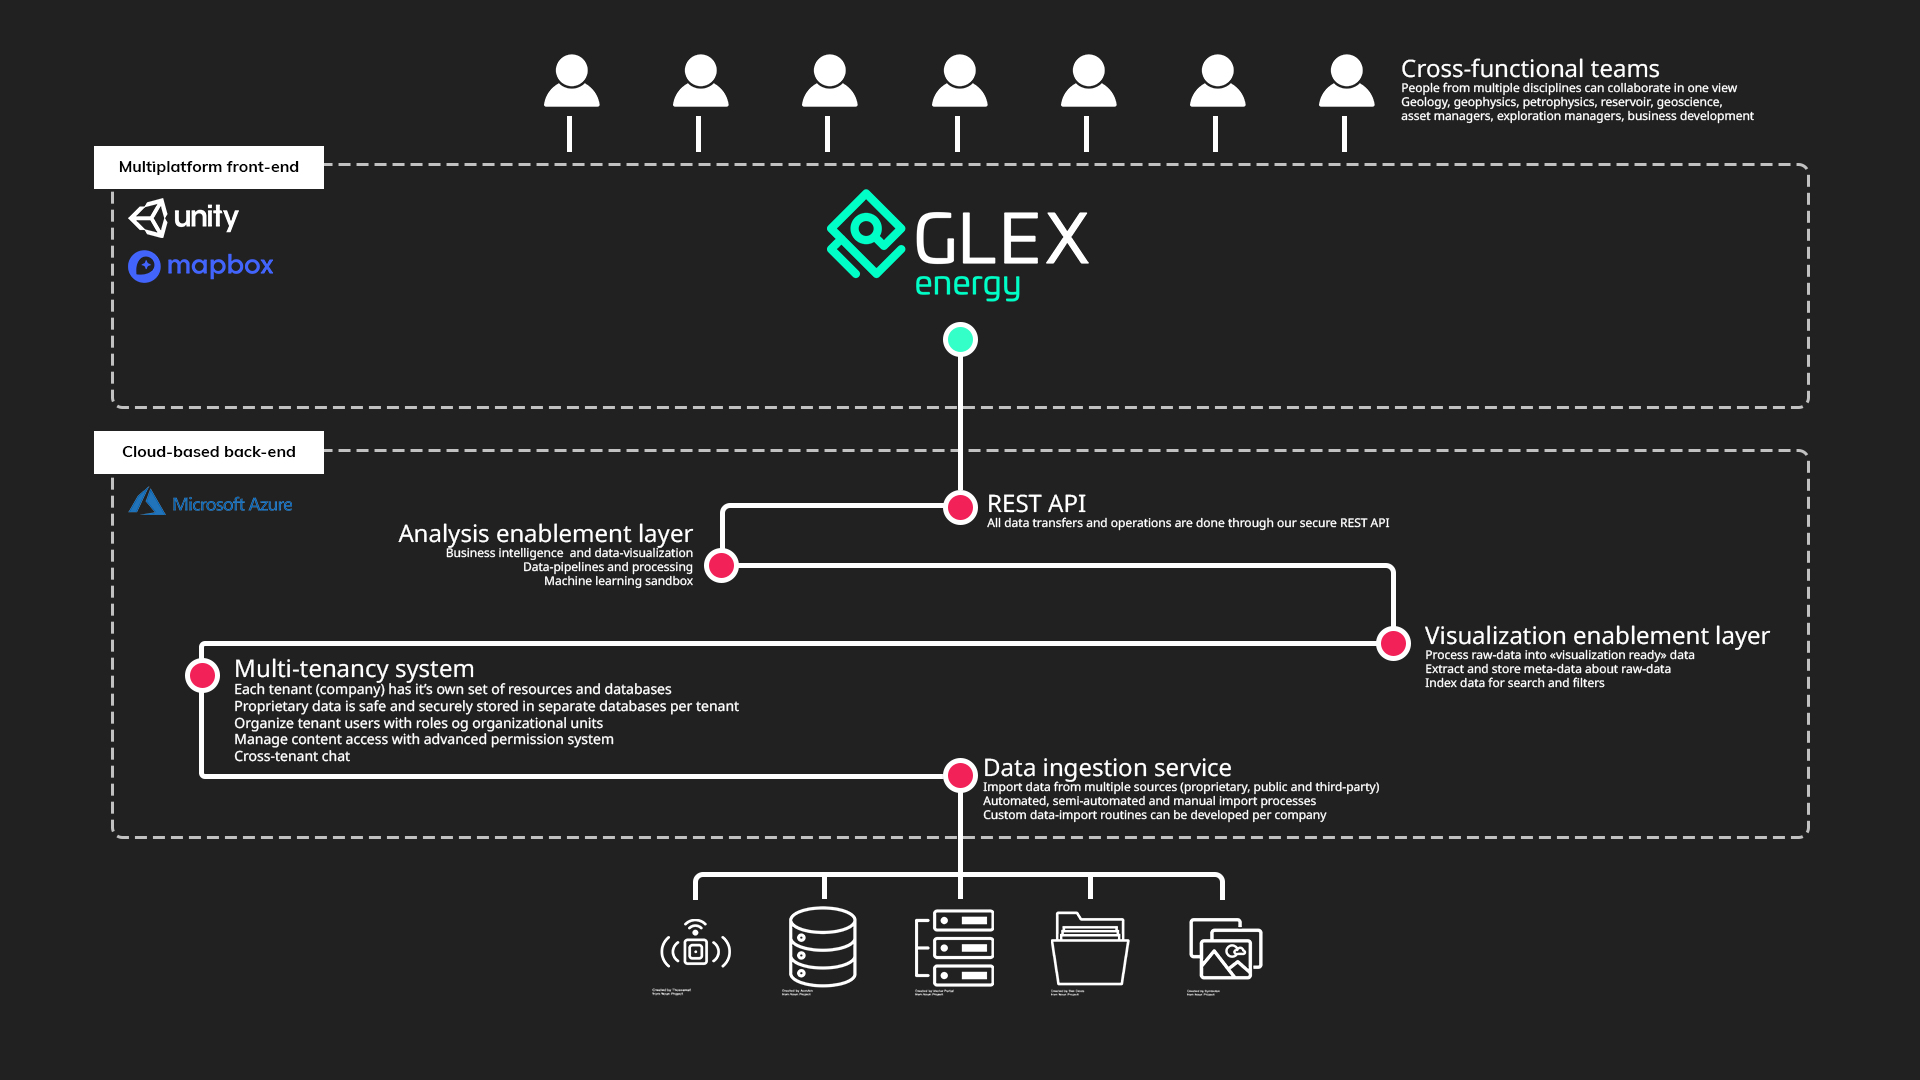
The cloud based, API centric architecture works on top of any data-platform, and facilitates data visualization, analysis and integrations. Proprietary data is stored securely in customer-specific databases, while public data is shared among multiple organizations, all controlled by a robust data access layer.
We work with a range of different public data repositories, data providers and data platforms. Take a look below, to see if the data you are interested in is already available.
Source
NOD (Norway)
DISKOS (Norway)
Wittemann (Norway)
Westwood
TGS FMB
OSDU
NVE (Norway)
NSTA (UK)
NLOG (Netherlands)
GEUS (Denmark)
Full
Partial
Demand
*These sources have specific license and/or hardware requirements, which means they are available, but need to be set up
Wellbores
Licences
Relinquished prospects (NCS)
TB of data
By implementing Glex into your organization you will enable your cross-functional teams to create a better common overview, improve collaboration and communication, and, most importantly, make better data-driven decisions.
Increase productivity by cutting time doing manual work and looking for data. Screen and analyze more scenarios and opportunities.
Promote collaboration by keeping a shared view with your colleagues, staying updated on data-changes and work done and keeping data flowing between disciplines.
Improve team communication by task assignment, chat, comments and more, right inside the software.
Increase organizational overview by having easy access to always-updated data, in context - always
Enable data-driven decision making through a shared visual interface with deep analytical tools
Easily present facts and findings, internally or externally