Stay up to date on critical metrics and KPI's
We develop bespoke dashboards which can be used to keep track of hydrocarbon production, offshore wind farm performance, CO2 injection, exploration licence statuses and more.
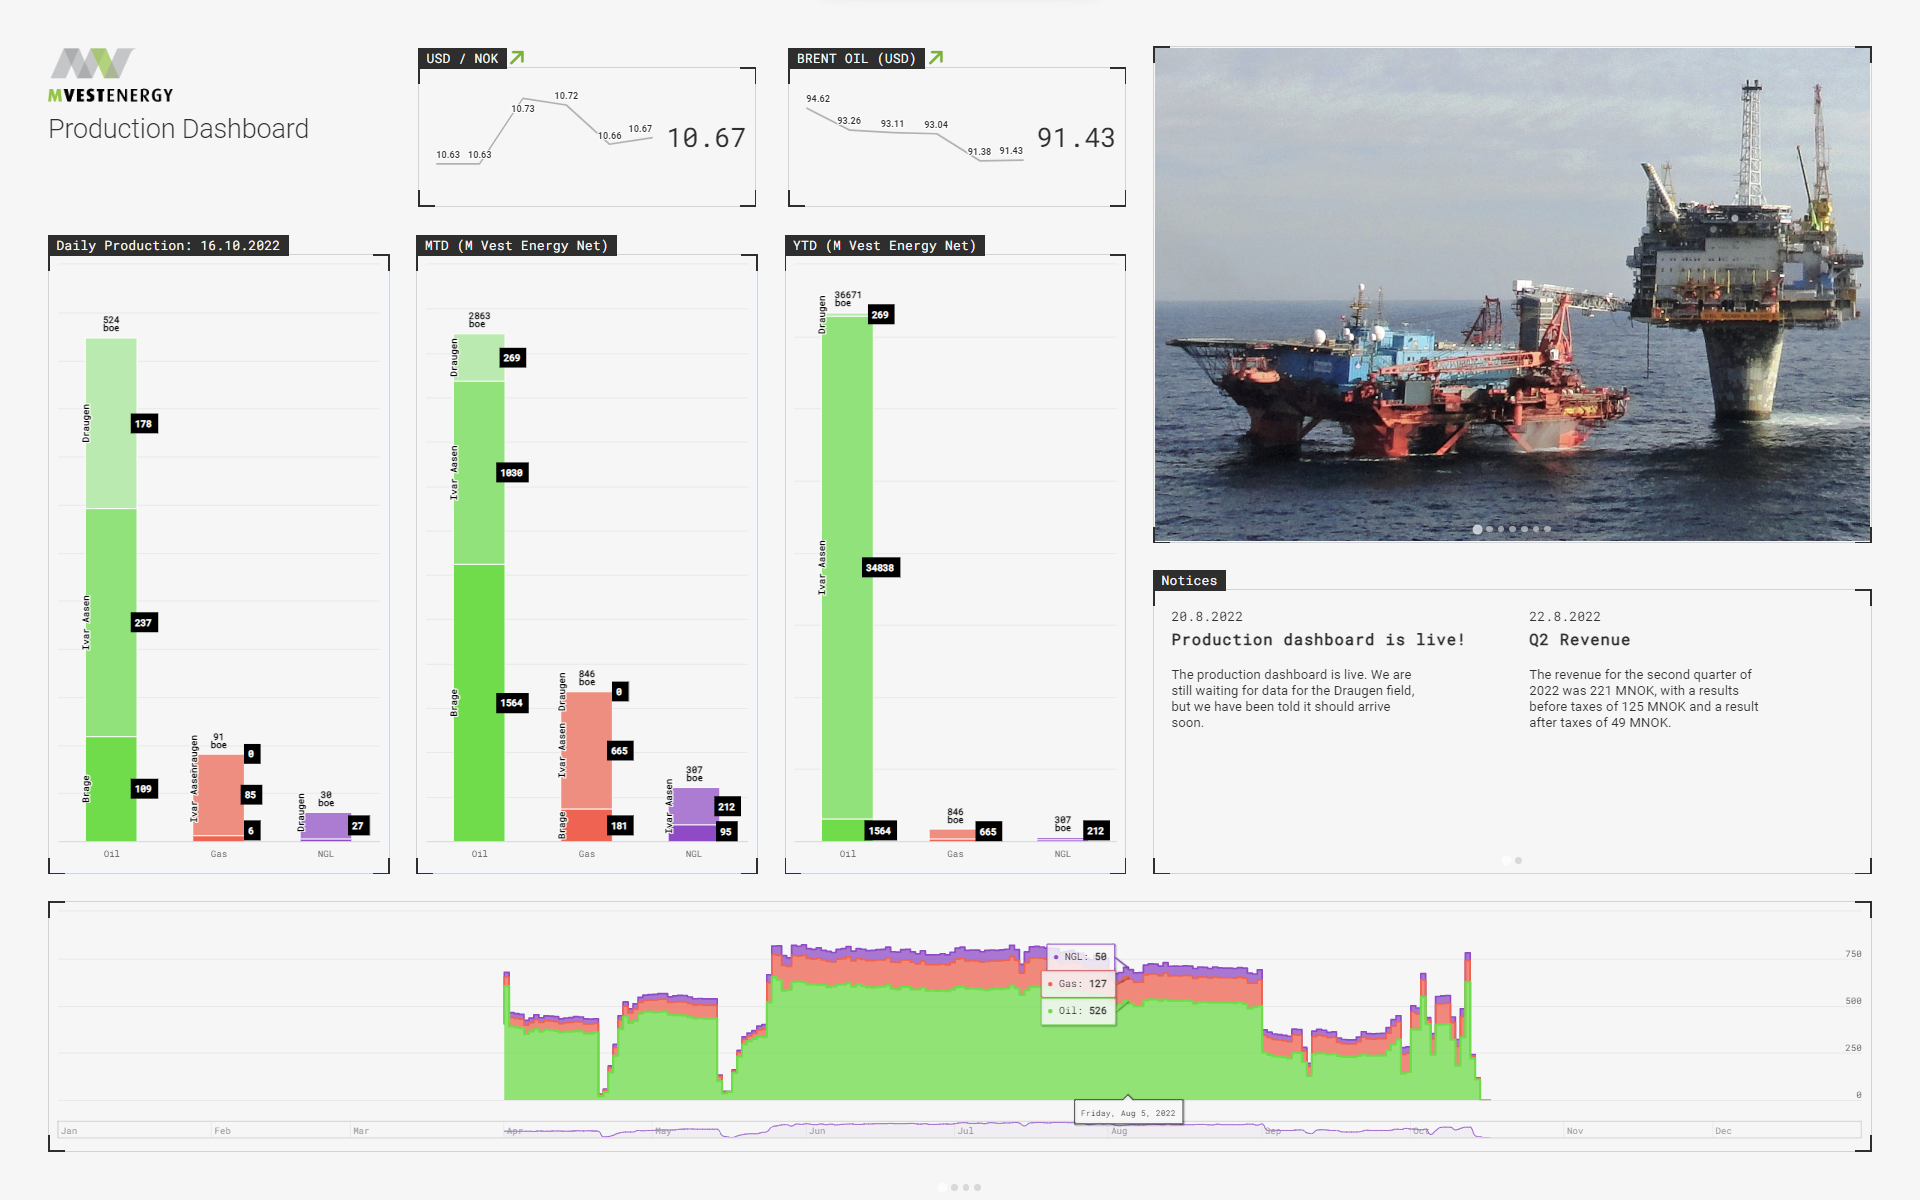
Our dashboards are made to measure will help you stay up to date on important KPI's like production numbers, forecasts vs. actual, budgets, dollar prices, oil prices, AIS traffic, and more.
Don't take our word for it, try it out yourself.
Combine data from a range of sources, including NPD, Diskos, Collabor8, Gassco, and more.
We collaborate with multiple data providers and other software companies to make sure we deliver the data you need.

Add interactive maps, 3D models of your infrastructure, subsurface data, and more and visualize data in both 2D and 3D space. Make sure your dashboards are unique and eye catching.
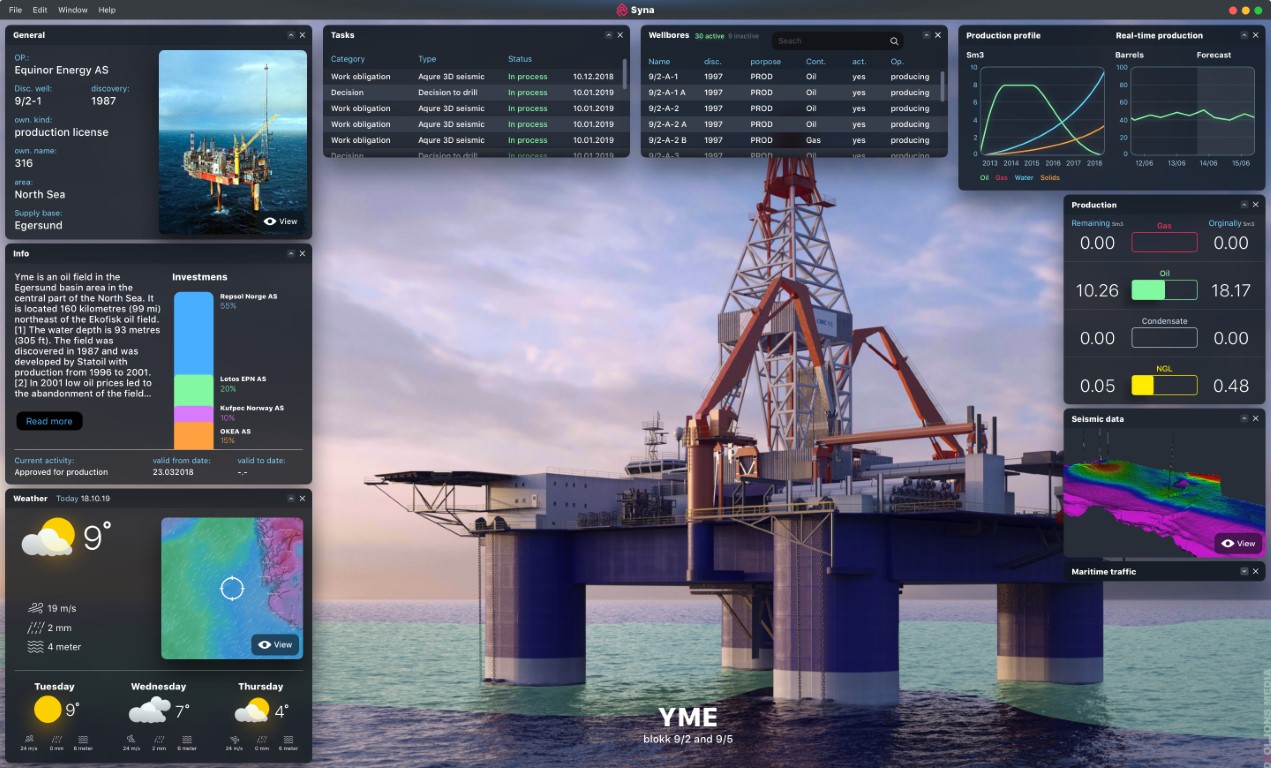
Customize what you want to include in your dashboard. Select from a range of pre-defined components, including graphs, images, videos, stock tickers, weather and more. We will help you define new ones as the need arises.
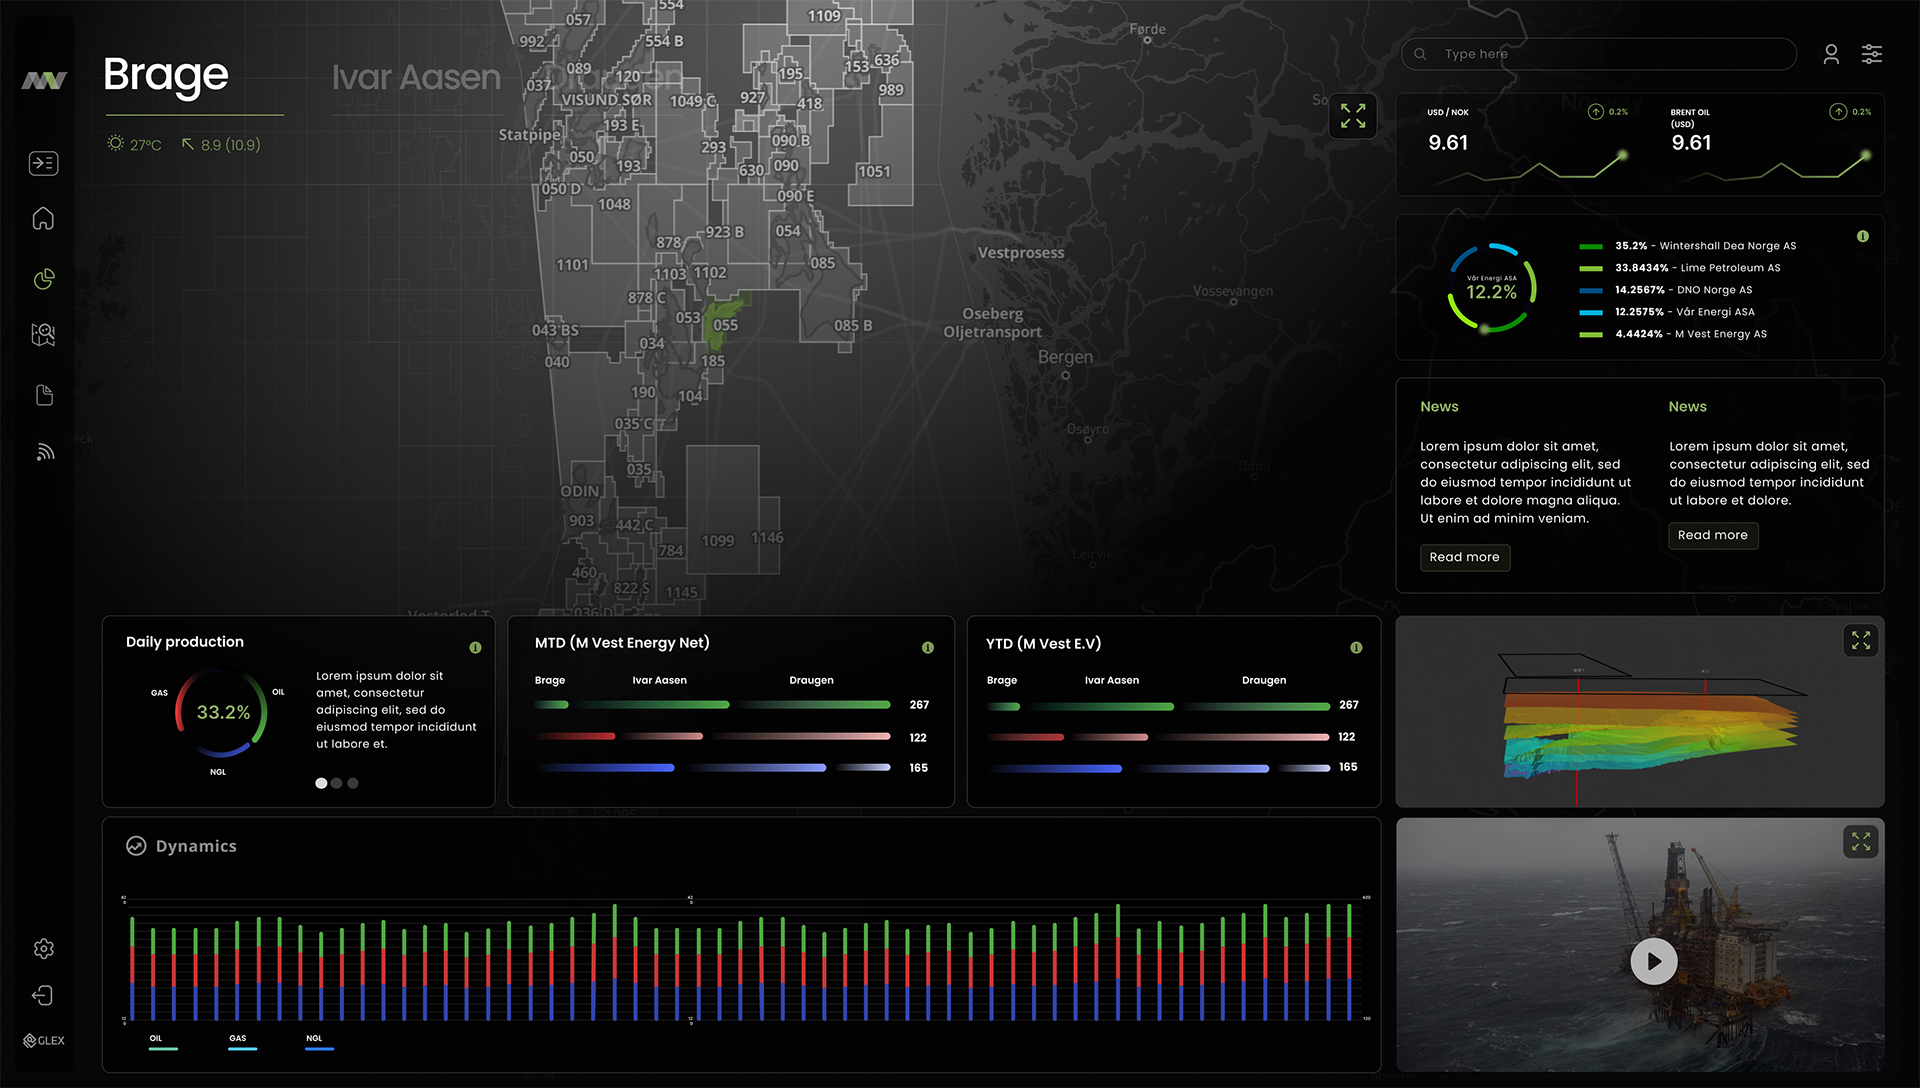
Customize the look of the dashboard to fit your brand, business profile and information sharing needs. Create multiple themes, and utilize different levels of complexity for different surfaces.
Todays energy companies depend on analysing enormous amounts of data in order to increase value and reduce risk. Data comes from multiple sources, in various data formats, and is continuously being updated. As data grows in size it is increasingly time-consuming to keep information up-to-date and in the hands of relevant people. Without the right data pipelines and dashboards in place, human errors easily occurs. By using a live dashboard from Glex, your data is automatically loaded and updated, and your people can spend their time on analysing the data instead of searching for them. In Glex these updated data is put in to a visual context, making it easy to share knowledge and interact with colleagues. Having continuous access dashboard with live information makes it very easy to build presentations for decision makers, ensuring that decisions is taken based on the latest and most updated knowledge.
Having continuous access to live data ensures everyone who needs it has the full overview, at all times.
Less time spent wrangling data means more time spent analysing them
Automated pipelines, data QA, and live dashboards reduces the chances for human errors when managing critical information
Easily share the latest and most updated information with stakeholders and decisionmakers.
Enter your contact information and we will get in touch with pricing and licensing information.